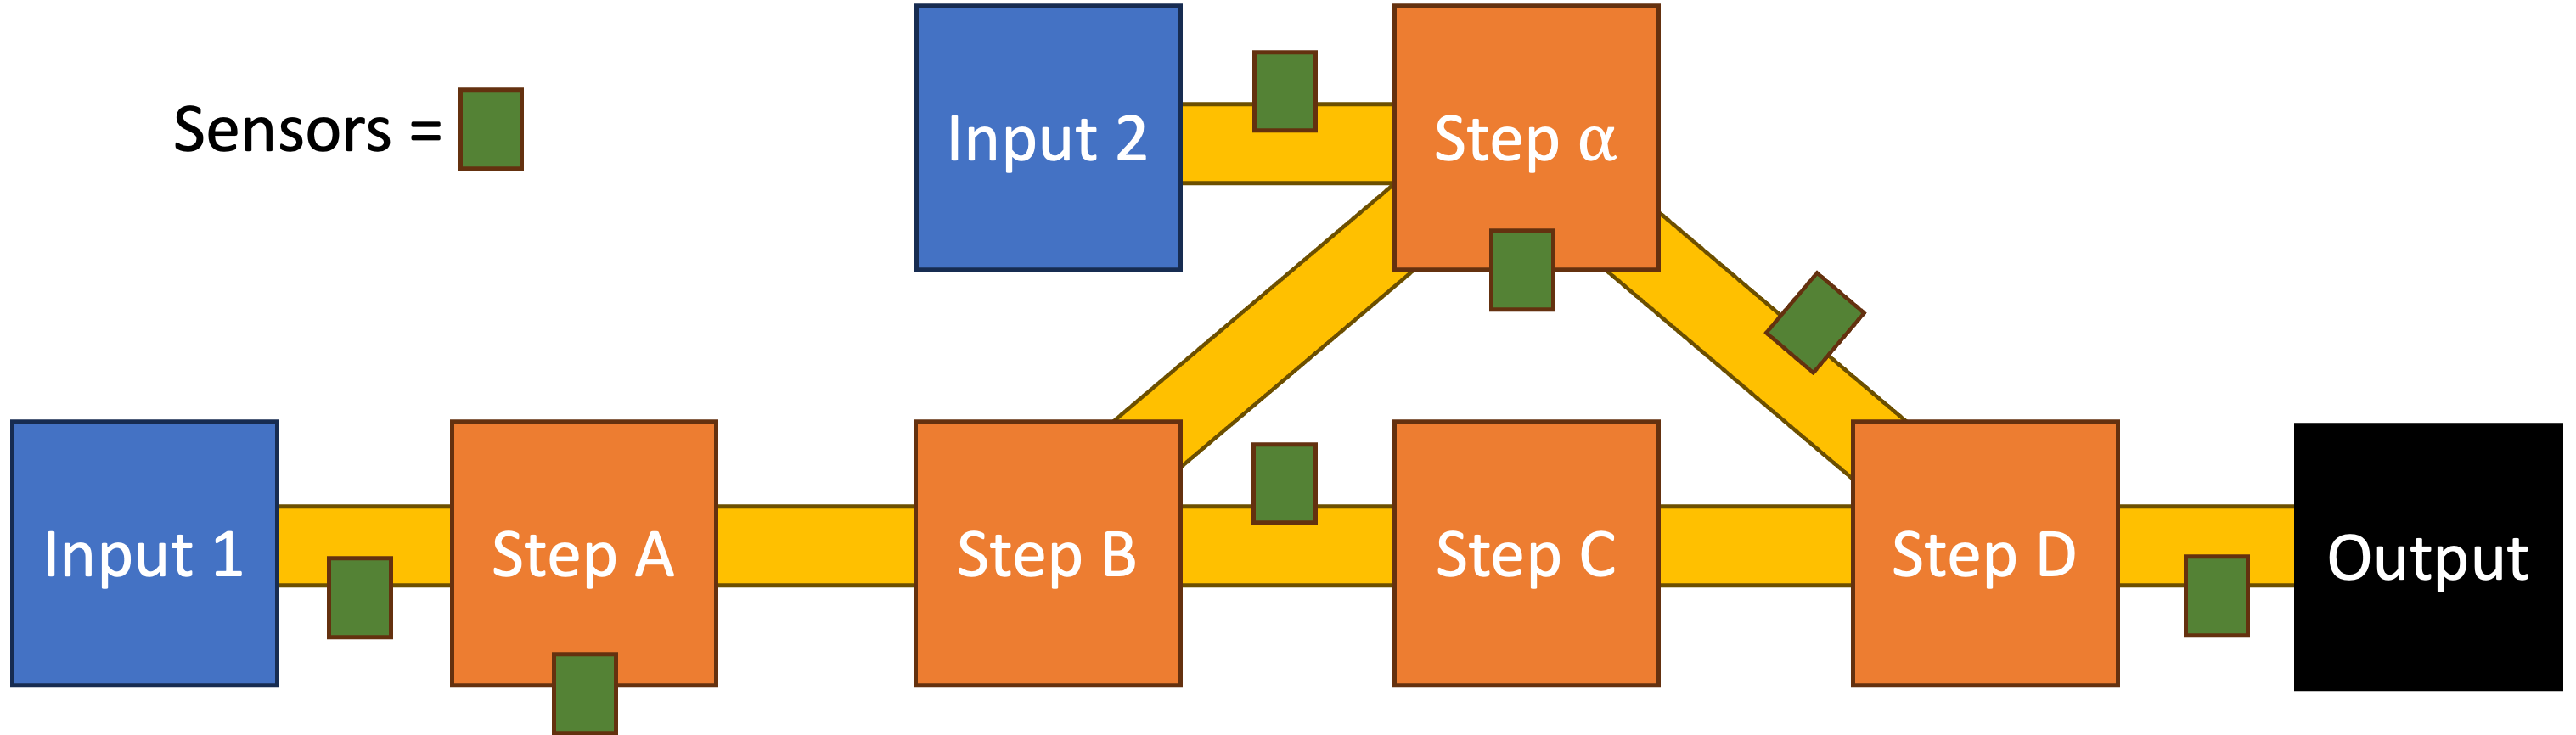
When merging time-dependent data from different sources, matching them well is important, but also comes with some choices.
If time series are to be used in Machine Learning, exact synchronisation is usually needed, i.e., equal timestamps on each variable.
For plotting purposes different time resolution, e.g., weeks vs months, may not be a problem as long as the different cycles match up.
# Create a time series with a frequency of 1 hour and a length 72*24 hours
import pandas as pd
import numpy as np

rng = np.random.default_rng(1979)
stock = rng.standard_normal(72).cumsum() + 2
days = pd.date_range('2021-01-01', periods=72, freq='D')

rng2 = np.random.default_rng(1000)
electricity = rng2.standard_normal(72*24).cumsum()+30
hours = pd.date_range('2021-01-01', periods=72*24, freq='h')
# Plot the two series in the same plot
import matplotlib.pyplot as plt
fig, ax = plt.subplots(figsize=(7, 2))
ax.plot(days, stock, label='stock')
ax.plot(hours, electricity, label='electricity')
ax.legend()
plt.show()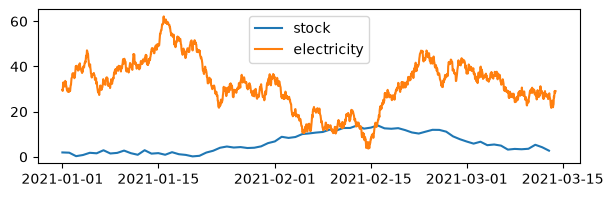
Accumulation
If a higher resolution time series is to be synchronized with a lower resolution series, some type of accumulation needs to be done.
Things to keep in mind:
Which type of accumulation should be done, e.g., sum for count data, mean for intensity data?
Should we use simple statistics, robust statistics or smoothed series data?
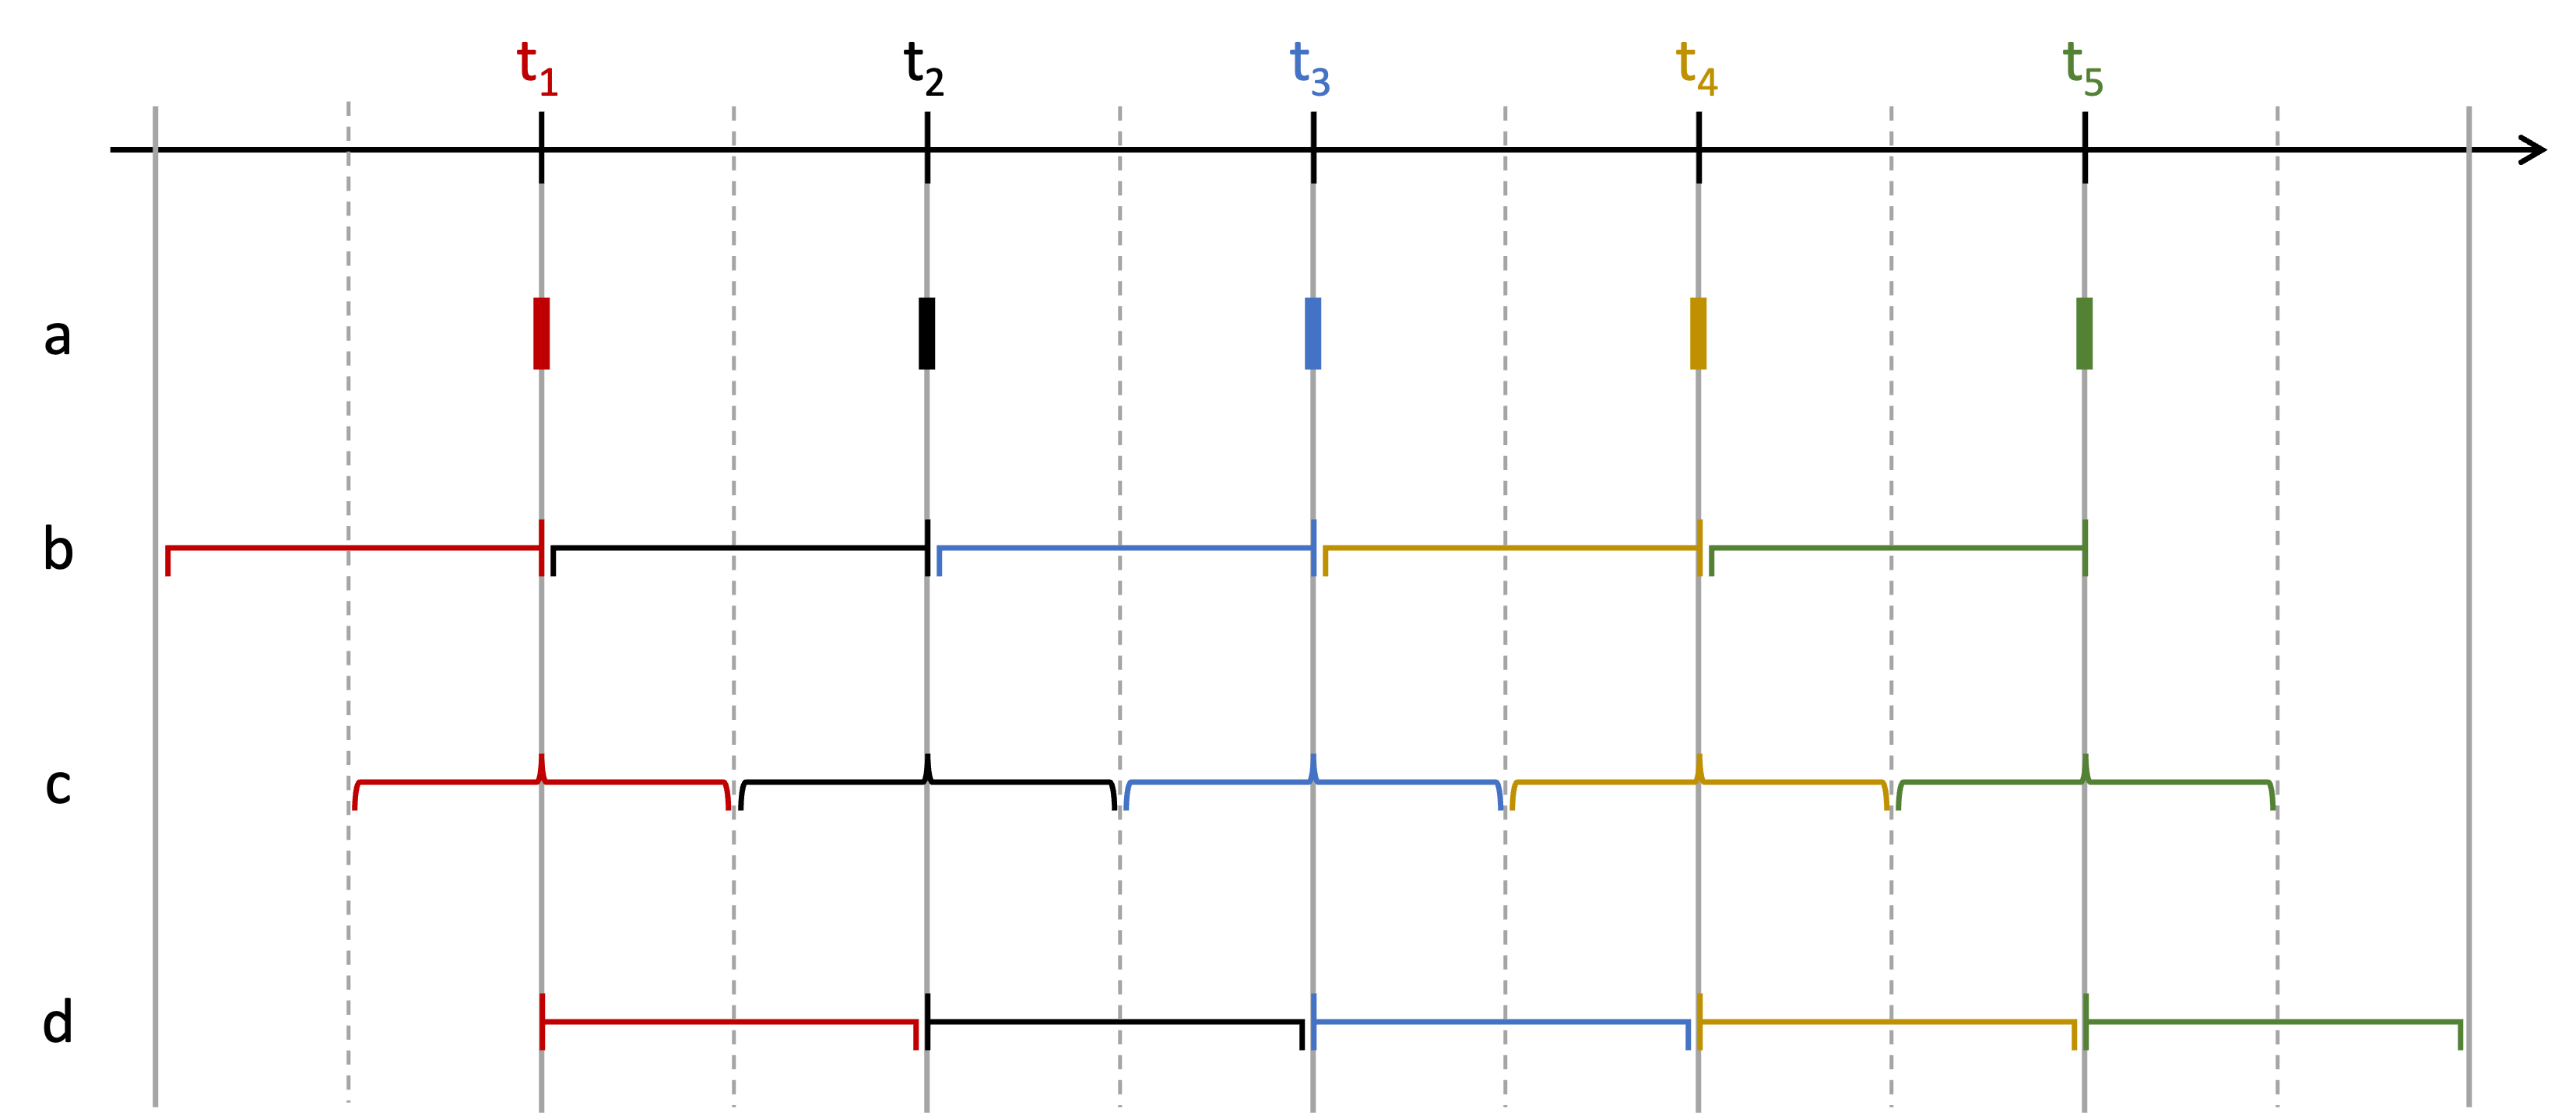
Are the low resolution recordings a series of snapshots (a) or an accumulation between (before (b)/after (d)) or around (c) timepoints (see illustration)?
This coresponds to the different uses of filters in the Noise reduction section.
... which also means that it is possible to echange simple averages with other smoothers.
# Turn the hourly series into a daily series by taking the mean of each day
daily2 = electricity.reshape(72, 24).mean(axis=1)
print(daily2.shape)
daily2[:5]
(72,)
array([30.97322385, 34.35672352, 39.15225169, 42.54404014, 36.29402279])Question: Is the mean calculation above an accumulation of type a, b, c or d (as compared to the illustration)?
# Make a dataframe of days and daily
df_days = pd.DataFrame({'days': days, 'stock': stock})
# .. and hours and hourly
df_hours = pd.DataFrame({'hours': hours, 'electricity': electricity})
df_hours.head()# Group the hourly series by day and take the mean of each day
daily3 = df_hours.electricity.groupby(df_hours.hours.dt.date).mean()
daily3.name = 'electricity' # <- Will be column name in dataframe
# Change name of index to days
daily3.index.name = 'days'
# Convert index to datetime
daily3.index = pd.to_datetime(daily3.index) # <- Important for matching with other datetimes!
daily3.head()days
2021-01-01 30.973224
2021-01-02 34.356724
2021-01-03 39.152252
2021-01-04 42.544040
2021-01-05 36.294023
Name: electricity, dtype: float64# Concatenate the daily series and the daily3 series
daily4 = pd.concat([pd.DataFrame({"stock":stock}, index=days), daily3], axis=1)
daily4# Plot the two time series in daily4 using Pandas plot
daily4.plot()
plt.show()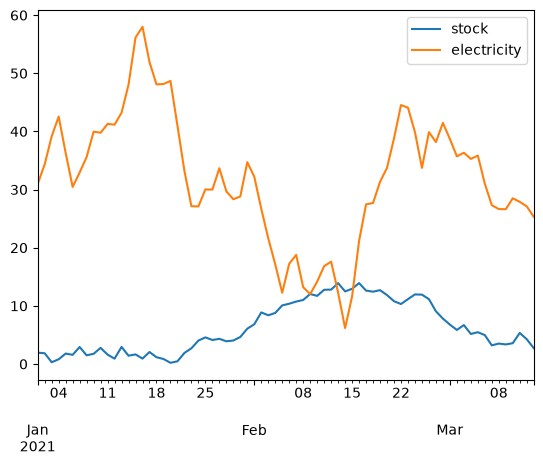
Interpolation
Timepoints may not match as easily as with days and hours above.
If one series is shifted slightly, the series are irregular in timesteps or have non-intuitive intervals, interpolation is an alternative.
When interpolating an irregular sequence in Pandas, one may need to resample to a higher frequency, fill the missing values and resample to the final frequency (see example below).
# Create a time series with irregular frequency
irr_dates = pd.date_range('2000-01-01 00:00', periods=365, freq='D') # <- Higher accuracy applied here to enable sampling

# Sample 50 random dates from irr_dates
m = np.arange(0,365,1)
rng.shuffle(m)
irr_dates = irr_dates[np.sort(m[:50])].sort_values()

# Create a series with random values and the sampled dates as index
irr_series = pd.DataFrame({'values': rng.standard_normal(50)}, index=irr_dates)
#irr_series.head()
print(irr_series)
values
2000-01-04 0.490463
2000-01-07 1.274086
2000-01-08 -0.485563
2000-01-19 0.886186
2000-01-21 -0.331479
2000-01-28 -0.039743
2000-01-30 0.477419
2000-02-19 0.814175
2000-02-26 -0.835243
2000-03-09 -1.014372
2000-03-22 0.125960
2000-04-07 -0.459632
2000-04-12 0.412295
2000-04-17 0.722275
2000-04-24 0.476232
2000-05-13 0.772985
2000-05-17 -0.650375
2000-05-22 -1.162162
2000-05-30 -0.086559
2000-06-03 0.286860
2000-06-21 0.059377
2000-06-22 -0.928979
2000-06-27 -1.953670
2000-07-03 0.294007
2000-07-14 -1.251394
2000-07-17 -1.134486
2000-07-24 1.254263
2000-07-26 1.509980
2000-07-29 -0.198877
2000-08-04 -0.532344
2000-08-07 -0.045698
2000-08-26 -0.090330
2000-09-03 2.802757
2000-09-07 -3.711439
2000-09-08 0.041011
2000-09-09 -0.014421
2000-09-12 -1.781971
2000-09-16 0.336200
2000-09-28 -0.027597
2000-10-06 0.013211
2000-10-12 2.575837
2000-10-13 -1.140271
2000-10-23 -1.149615
2000-10-28 1.270556
2000-10-29 0.021922
2000-11-11 0.701834
2000-11-20 0.209048
2000-11-23 -0.972874
2000-11-30 -0.407151
2000-12-28 -0.473028
# Interpolate the series to weekly frequency without intermediate resampling
weekly = irr_series.resample('W').interpolate("linear")
weekly.head()# Plot the two series
fig, ax = plt.subplots(figsize=(7, 2))
ax.plot(irr_series, label='irregular')
ax.plot(weekly, 'o', label='weekly')
ax.legend()
plt.show()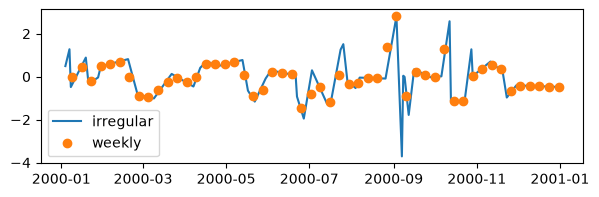
# Interpolate the series to weekly frequency after resampling to daily frequency
daily_x = irr_series.resample('D').interpolate("linear")
weekly = irr_series.resample('D').interpolate("linear").resample('W').interpolate("linear")
weekly.head()# Plot the two series
fig, ax = plt.subplots(figsize=(7, 2))
ax.plot(daily_x, 'o', label='interpolated daily')
ax.plot(irr_series, 'o', label='irregular')
ax.plot(weekly, label='weekly')
ax.legend()
plt.show()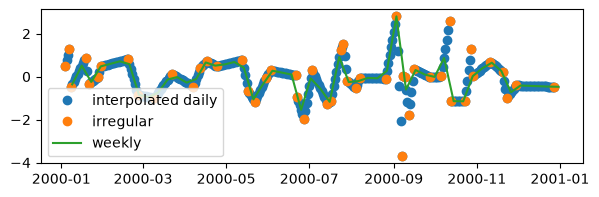
Time delays
Industrial processes often have a continuous or batchwise handling of raw materials into other materials or products.
When sensors record data along the production line, matching a piece of raw material to sensor readings can be done by adding a delay to the timestamp of the measurements early in the process or subtracting time from the later measurements.
For some processes, the delay is a known, fixed quantity.
For others the delay may be dependent on dynamic factors like raw material properties or process settings that add uncertainty to the time delay.
Synchronising such data, may require optimising correlations between sensors or using more advanced warping techniques.