Missing data can occur in a series or stream in different ways:
In some cases, this means we need to have logic handling different events or types of data that are not always included, e.g., precipitation in weather data which could be rain or snow, possibly reported separately as with OpenWeatherMap.
For the rain/snow, the missing value is trivial, i.e., missing means 0.
Random dropouts of streams and randomly missing data due to sensor malfunctions, network glitches, maintenance, etc. can make subsequent analyses faulty.
If data are missing systematically, this can either make imputation easy (we know what the values should have been) or biased (the imputation is consistently wrong).
Simple imputation
For variables that we assume have a fixed distribution, imputing with the mean, trimmed mean or median value can be sufficient.
scikit-learn’s SimpleImputer contains the basic imputations.
# Read the banana dataset from the data folder
import pandas as pd
df = pd.read_csv('../../data/bananas.csv')

# Assume that the maximum value is an outlier we want to remove and replace with NaN
import numpy as np
df.loc[df['length'] == df['length'].max(), 'length'] = np.nan

# Count the number of missing values
print(df.isnull().sum())

df.describe()
length 1
dtype: int64
# Import simple imputer from sklearn
from sklearn.impute import SimpleImputer

# Impute the missing values with the mean
imputer = SimpleImputer(strategy='mean')
df_imputed = pd.DataFrame(imputer.fit_transform(df), columns=df.columns)

# Count the number of missing values
print(df_imputed.isnull().sum())

df_imputed.describe()
length 0
dtype: int64
Neighbour imputation
Instead of using “global” values, i.e., mean, median, etc., a different strategy is to take inspiration from neighbouring observations.
If a single variable is used, neighbours can be objects close in the sequence.
If multiple variables are used, neighbours can be objects with similar properties in the remaining (non-missing) variables.
The size of the neigbourhood, K, as in K Nearest Neighbours, can be used to smooth (large K) or ensure local adaption (small K).
scikit-learn’s KNNImputer works well on tabular data.
# Our friend, the random series
rng = np.random.default_rng(0)
y = rng.standard_normal(301).cumsum()

# Plot the numbers
import matplotlib.pyplot as plt
plt.figure(figsize=(6, 4))
plt.plot(y, label='Random curve')
plt.xlabel('arbitrary units')
plt.ylabel('amplitude')
plt.legend()
plt.show()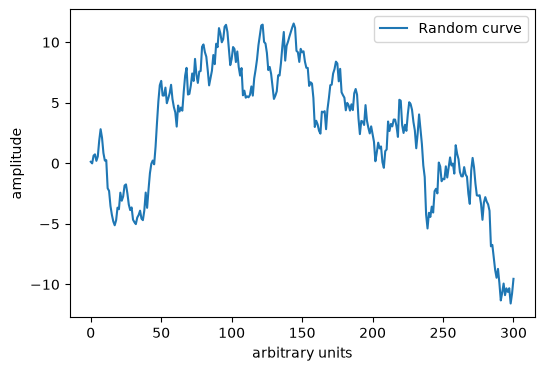
# Assume that the 302nd value is missing, i.e., add a NaN to the end of the series
y_NaN = np.append(y, np.nan)

# Impute the value using the mean
imputer = SimpleImputer(strategy='mean')
y_imputed = imputer.fit_transform(y_NaN.reshape(-1, 1))

# Print the imputed value
print(y_imputed[-1])
[2.70866691]
# Import the imputer for nearest neighbors
from sklearn.impute import KNNImputer

# Impute using the three nearest neighbors
imputer = KNNImputer(n_neighbors=3)
y_imputed_NN = imputer.fit_transform(y_NaN.reshape(-1, 1))

# Print the imputed value
print(y_imputed_NN[-1])

# Note! See next cell!
[2.70866691]
Discussion point
What happened to our imputation above?
Why did it not work as expected?
Imputation in time series
Most of scikit-learn’s imputers are made for tabular data.
Each sample is seen as independent of the order.
Time series data are strictly ordered.
Imputation techniques for time series:
Last Observation Carried Forward (LOCF).
Next Observation Carried Backward (NOCB).
Interpolation, e.g., linear between neighbour points, local polynomial fitting, splines.
def LOCF(x):
    """Last observation carried forward."""
    y = x.copy()
    for i in range(1, len(y)):
        if np.isnan(y[i]):
            y[i] = y[i - 1]
    return y

def NOCB(x):
    """Next observation carried backward."""
    y = x.copy()
    for i in range(len(y) - 2, -1, -1):
        if np.isnan(y[i]):
            y[i] = y[i + 1]
    return y
# Perform LOCF
y_locf = LOCF(y_NaN)
# Plot the numbers
import matplotlib.pyplot as plt
plt.figure(figsize=(6, 4))
plt.plot(y, label='Random curve')
plt.plot(len(y_locf)-1, y_locf[-1], '.', label='LOCF')
plt.xlabel('arbitrary units')
plt.ylabel('amplitude')
plt.legend()
plt.show()
print('The LOCF imputed value is', y_locf[-1])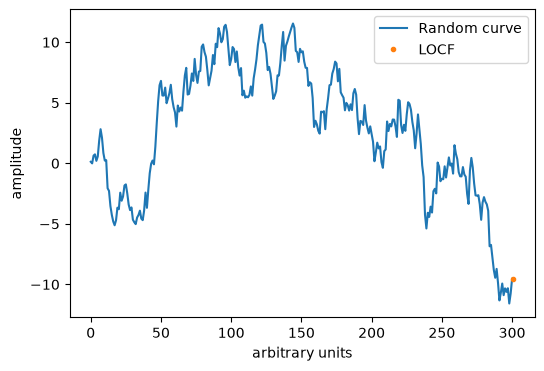
The LOCF imputed value is -9.541817479586834
Interpolation
When a time series has consecutive dropouts, interpolation can make better imputations.
Pandas’ Series interpolation includes many different interpolations, e.g., linear, polynomial, splines, etc.
We will knock out a few points and compare some interpolations.
# Knockout
y_NaN[145:150] = np.nan

# Perform linear interpolation using the pandas function
y_linear = pd.Series(y_NaN).interpolate() # Default is linear interpolation
y_spline = pd.Series(y_NaN).interpolate(method='spline', order=3)

# Plot the numbers in a side by side plot where the left panel is the original series and the right panel a zoomed view of the imputed series
import matplotlib.pyplot as plt
plt.figure(figsize=(12, 4))
plt.subplot(1, 2, 1)
plt.plot(y, label='Random curve', color='black')
plt.plot(range(144,151), y_linear[144:151], label='Linear interpolation', color='red')
plt.plot(range(144,151), y_spline[144:151], label='Cubic spline', color='blue')
plt.xlabel('arbitrary units')
plt.ylabel('amplitude')
plt.legend()
plt.subplot(1, 2, 2)
plt.plot(y, label='Random curve', color='black')
plt.plot(range(145,150), y_linear[145:150], label='Linear interpolation', color='red')
plt.plot(range(145,150), y_spline[145:150], label='Cubic spline', color='blue')
plt.axvline(145, color='gray', linestyle='--')
plt.axvline(149, color='gray', linestyle='--')
plt.xlabel('arbitrary units')
plt.ylabel('amplitude')
plt.legend()
plt.xlim(130, 160)
plt.ylim(8, 12)
plt.title('Zoomed view')
plt.show()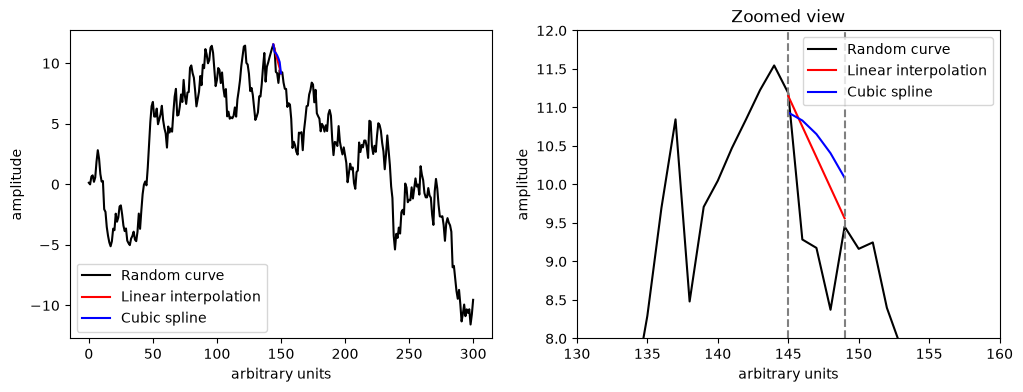
# Convert the plot above into Plotly graphics
import plotly.graph_objects as go
fig = go.Figure()
fig.add_trace(go.Scatter(y=y_linear, mode='lines', name='Linear interpolation'))
fig.add_trace(go.Scatter(y=y_spline, mode='lines', name='Spline interpolation'))
fig.add_trace(go.Scatter(y=y, mode='lines', name='Random curve'))
fig.update_layout(xaxis_title='arbitrary units', yaxis_title='amplitude')
fig.show()Multivariate data imputation
For multivariate data it makes sense to leverage the other variables when one variable contains a missing value.
Nearest Neighbour imputation was mentioned above as a candidate.
An alternative is to use an iterative imputer, e.g., scikit-learns’ Iterative Imputer which predicts each variable from the other variables, imputing and remodelling iteratively.
Exercise
Use the DEWP, TEMP and PRES variables of the Beijing pollution data (2000 timepoints).
Remove timepoints 1000 to 1005 from the DEWP series.
Apply the iterative imputer to recreate the missing data.
Compare the results to a simple mean imputation by plotting the DEWP for a suitable region around the missing observations.
Notebook Cell
# Dummy cell to ensure Plotly graphics are shown
import plotly.graph_objects as go
f = go.FigureWidget([go.Scatter(x=[1,1], y=[1,1], mode='markers')])