The terms outliers and anomalies can sometimes be synonymous, but have different origins in data analysis.
An outlier in statistics is typically defined with respect to some known (or assumed) distribution and its statistics.
An outlier in a dataset does not have the same properties as the majority of observations or is more extreme in some sense.
An outlier in a model is either extreme in the data distribution or its predictions deviate more from the truth than the typical observation does.
An anomaly in machine learning is typically an observation that deviates from the the majority of observations or from the samples in its local neighbourhood.
There are fewer assumptions about distributions in machine learning than statistics.
Outliers for 1D data
A simple representation of data is the box (and whiskers) plot.
A common choice is to stop the whiskers at 1.5 IQR, where IQR = 75th percentile - 25th percentile.
# Random data
import numpy as np
np.random.seed(1)
data = np.random.normal(0, 1, 1000)

# A boxplot of the data
import matplotlib.pyplot as plt
plt.boxplot(data)
plt.show()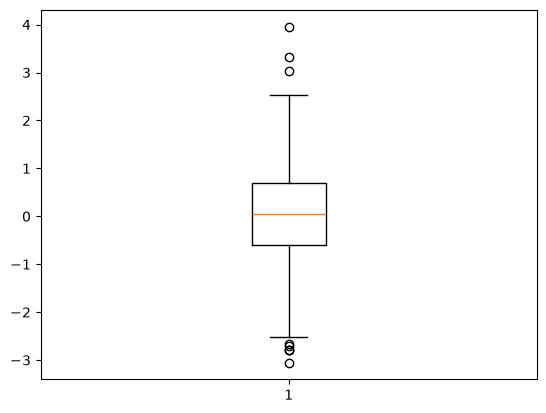
Boxplot properties
... assuming normal distributed data.
# Plot the normal probability curve from -4 to 4 with mean 0 and standard deviation 1
import numpy as np
import scipy.stats as stats
import matplotlib.pyplot as plt
plt.figure(figsize=(5,3))
x = np.linspace(-4, 4, 100)
y = stats.norm.pdf(x, 0, 1)
plt.plot(x, y, color='black')
plt.xlabel('Standard deviations')
plt.ylabel('Probability density')
plt.title('Standard normal probability curve')
# Add lines for the quartiles and whiskers
plt.axvline(stats.norm.isf(1-0.25))
plt.axvline(stats.norm.isf(1-0.75), label="Quartiles")
plt.axvline(stats.norm.isf(1-0.25) - (stats.norm.isf(1-0.75)-stats.norm.isf(1-0.25))*1.5, color='red')
plt.axvline(stats.norm.isf(1-0.75) + (stats.norm.isf(1-0.75)-stats.norm.isf(1-0.25))*1.5, color='red', label="+/- 1.5 IQR")
plt.legend()
plt.show()
# Print the value of the upeer whisker
upper = stats.norm.isf(1-0.75) + (stats.norm.isf(1-0.75)-stats.norm.isf(1-0.25))*1.5
print("Upper whisker: {:.3f} standard deviations".format(upper))
print("Probability of being outside whiskers: {:.3f}%".format(stats.norm.cdf(upper)*2))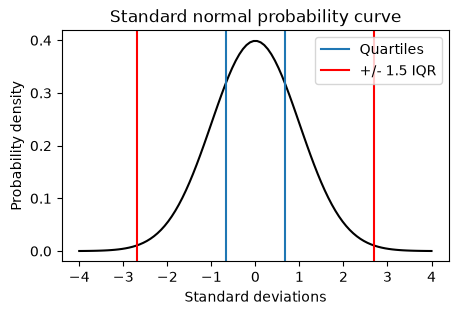
Upper whisker: 2.698 standard deviations
Probability of being outside whiskers: 1.993%
Outliers in models
An outlier in the input data, X, will influence some models more than a central point would do.
In regression (Ordinary Least Squares), these are called high leverage points.
OLS for :
Leverage from the diagonal of .
An outlier in the response, y, can be caused by a model of wrong complexity.
Too complex: Overfitting, bad generalisation.
Too simple: Does not fit well enough to describe important variation.
Handling outliers/anomalies
An outier can be caused by errors in measurements, faulty registration or random variation.
Or it can be deviating because of unexplained, but important, phenomena.
Depending on the case at hand, there are several options for handling outliers:
Remove the outlying measurement - results in missing data.
Impute the values of the outlier, i.e., replace it by something inlying, e.g., average over nearest neighbours (pre-processing section).
Use a smoothed value according to the local trend (Noise reduction).
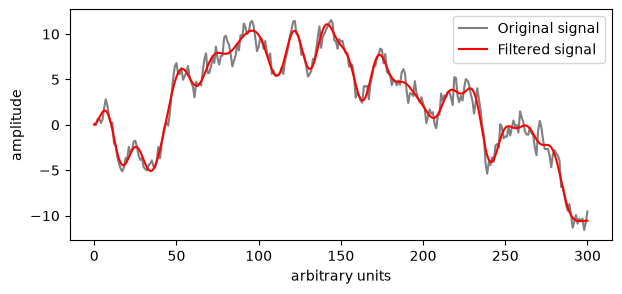
For visualisation, present a smoothed signal, but show the underlying variation as a shadow or error region (shown below).
Or mark outliers in the plot with contrasting colour (Outlier statistics)
Sound an alarm, e.g., a warning sign, alerting an operator to potential problems (dashboard section).
# Random signal
N = 301
rng = np.random.default_rng(0)
y = rng.standard_normal(N).cumsum()

# Remove frequencies above 40, i.e., a low-pass filter.
from scipy.fft import dct, idct
W = np.arange(0, N) # Frequency axis
filtered_fourier_signal = dct(y)
x = filtered_fourier_signal.copy()
filtered_fourier_signal[(W > 40)] = 0
cut_signal = idct(filtered_fourier_signal)

# Plot the curve
plt.figure(figsize=(7,3))
plt.plot(y, label='Original signal', color='gray')
plt.plot(cut_signal, label='Filtered signal', color='red')
plt.xlabel('arbitrary units')
plt.ylabel('amplitude')
plt.legend()
plt.show()