A dataset containing simulated data for 4 connected events where A is the
starting point and D is the end point. This can be described as a directed
acyclic graph (sketched below, moving left->right).
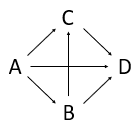
Subpaths include: ABD, AD, ABCD, ACD
A list of matrices having 200 rows and 10 variables:
- A
Simulated matrix A
- B
Simulated matrix B
References
Tormod Næs, Rosaria Romano, Oliver Tomic, Ingrid Måge, Age Smilde, Kristian Hovde Liland,
Sequential and orthogonalized PLS (SO-PLS) regression for path analysis: Order of blocks and relations between effects.
Journal of Chemometrics, In Press