Microsoft’s software is in the top three of Business Intelligence softwares according to 6sense.com
Behind Notion, ahead of Tableau late 2023
>5 million subscribers according to Microsoft
Primary platform is Windows
Can be run virtualised on Mac, e.g., using freeware virtualisation solution UTM with Windows 11 ARM (requires Windows Insider user) and 32-bit Power BI instalation.
Mainly controlled through menus and dialogues, but supports integration with languages like R and Python.
Data sources
Can connect to most major database, storage and API solutions, file formats and subscription service Dataverse.
Some sources require plugins/extensions to work, e.g., MySQL.
Pre-processing and Machine Learning
Has a Power Query Editor for data transformations including
format changing,
group bys and similar,
connection Azure Machine Learning (licence based).
Derived data (functions of data) called measures.
Coding/scripting
Power BI supports Python and R extensions at various stages of data handling.
Data import
Pre-processing and machine learning
Visualisation
Python must be enabled through the options in older versions.
Both Python and R need paths to be set correctly in the scripting options of Power BI.
For other environments than base, C:\Users<your-username>\AppData\Local\PowerBIScripting\PythonSettings.xml needs to be edited.
The webpage https://
bit .ly /powerbi -python -limits contains a list of Python and package versions currently supported by Power BI.
Dashboards
Plots similar to Excel, but more interactive, similar to plotly.
Various graphical elements reminiscent of PowerPoint.
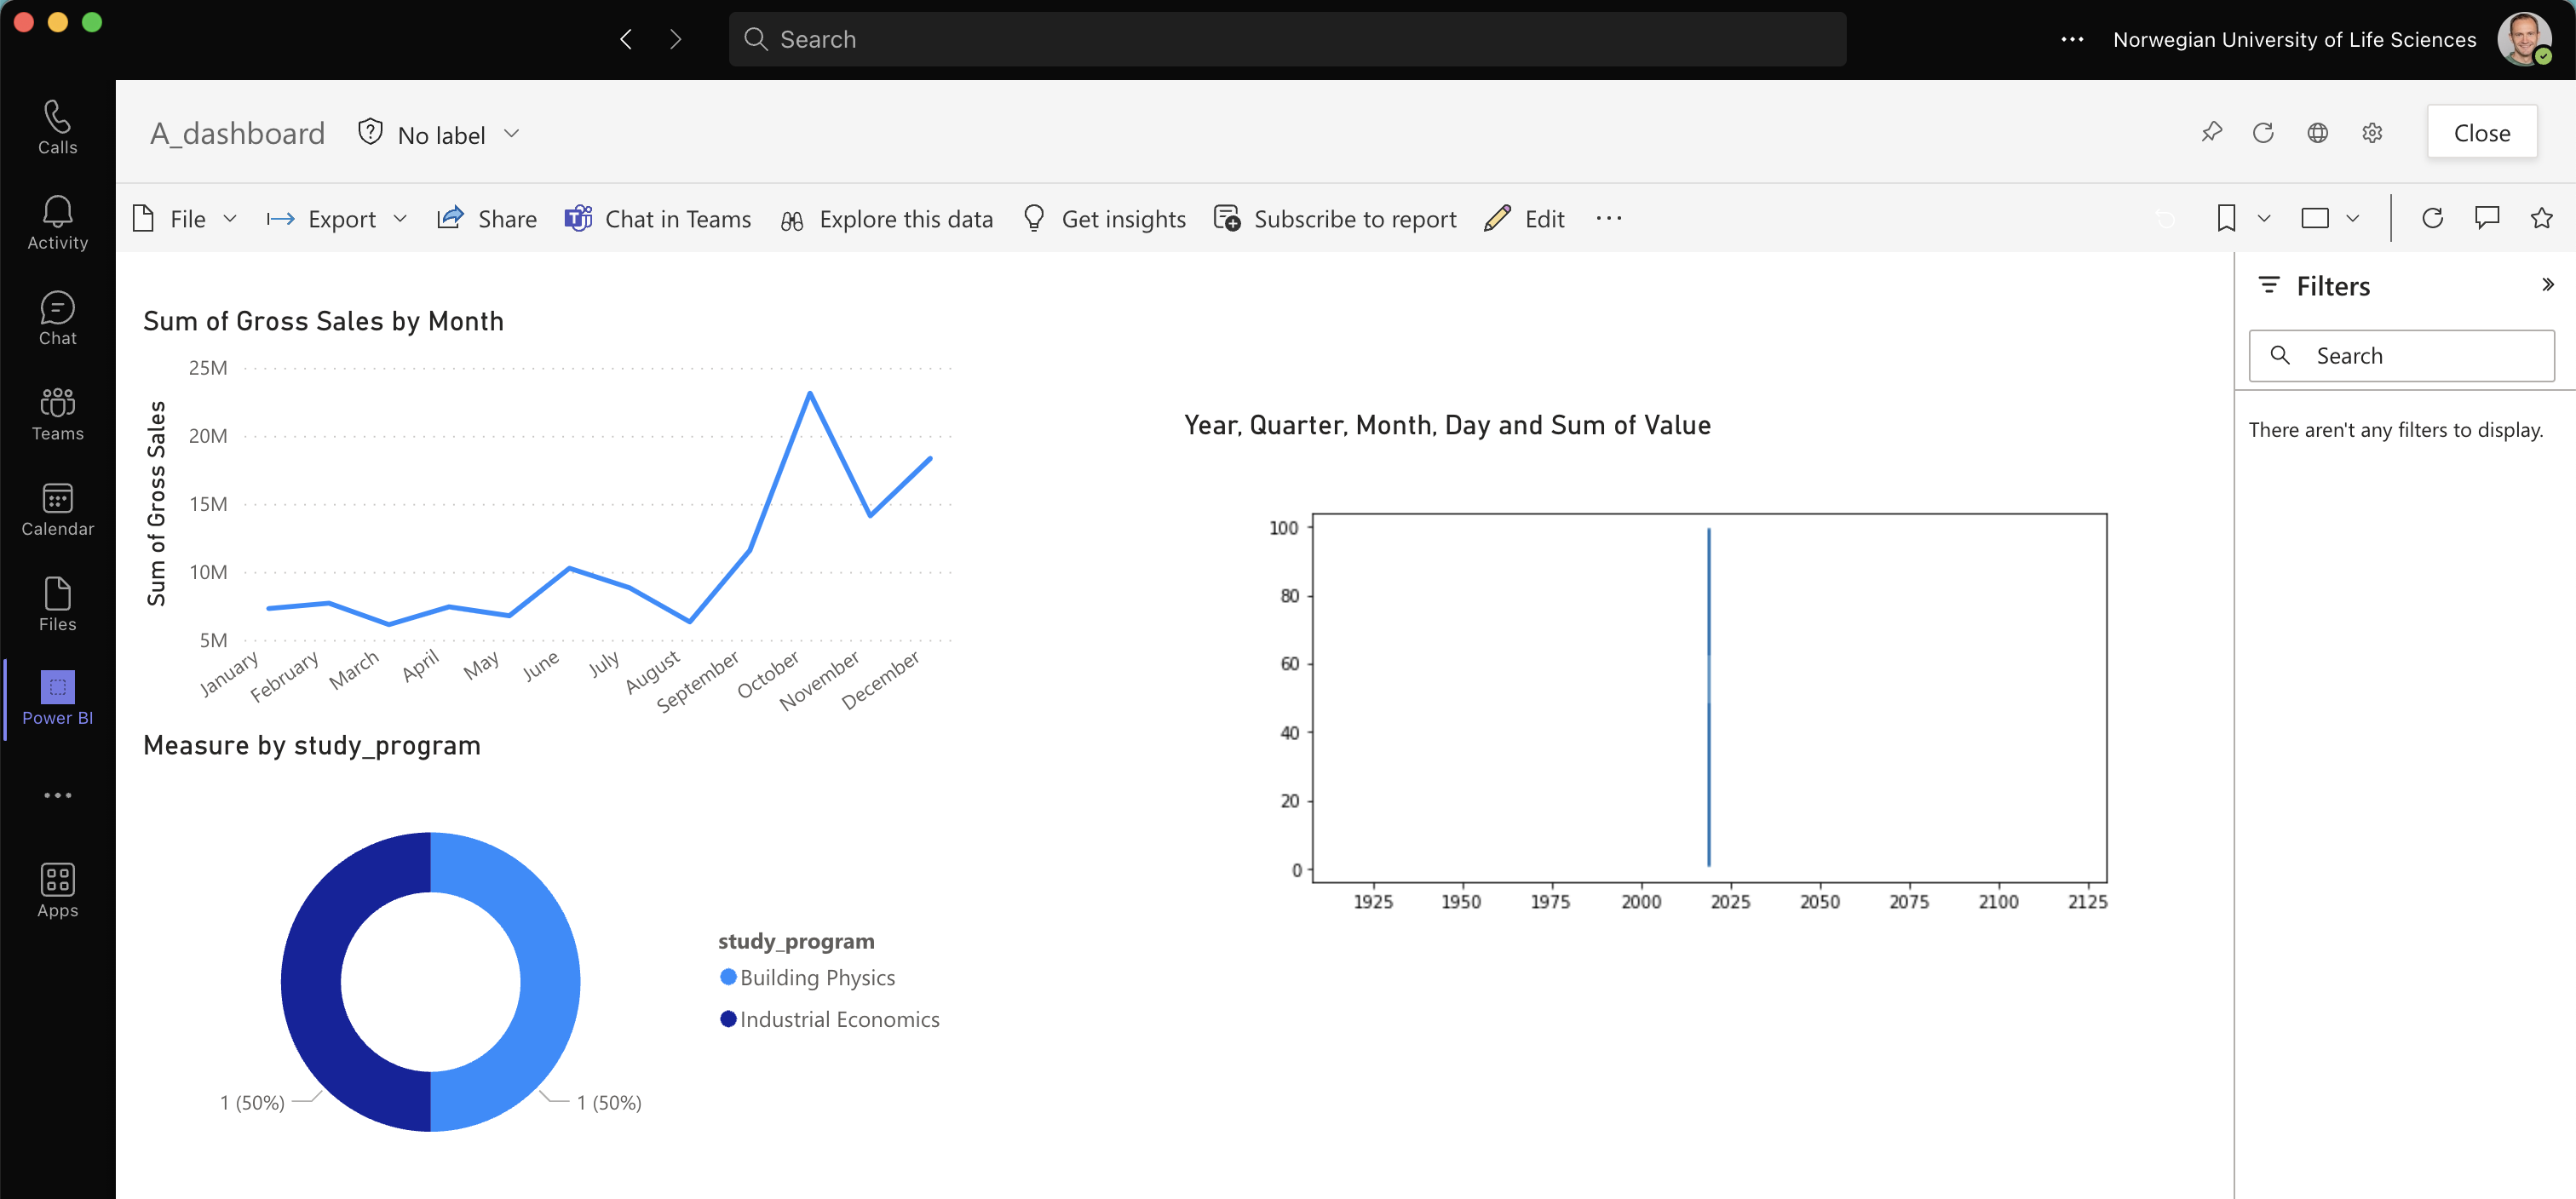
Can be deployed as a Power BI service, available in various forms, e.g., Teams apps.
Supports user roles based on credentials.
Main views when editing:
Model: Work on sources, underlying inputs to projects, data relations.
Data: Inspect, filter, connect data in tables.
Report: “what you see is what you get” visual editor for datsboards.
Example
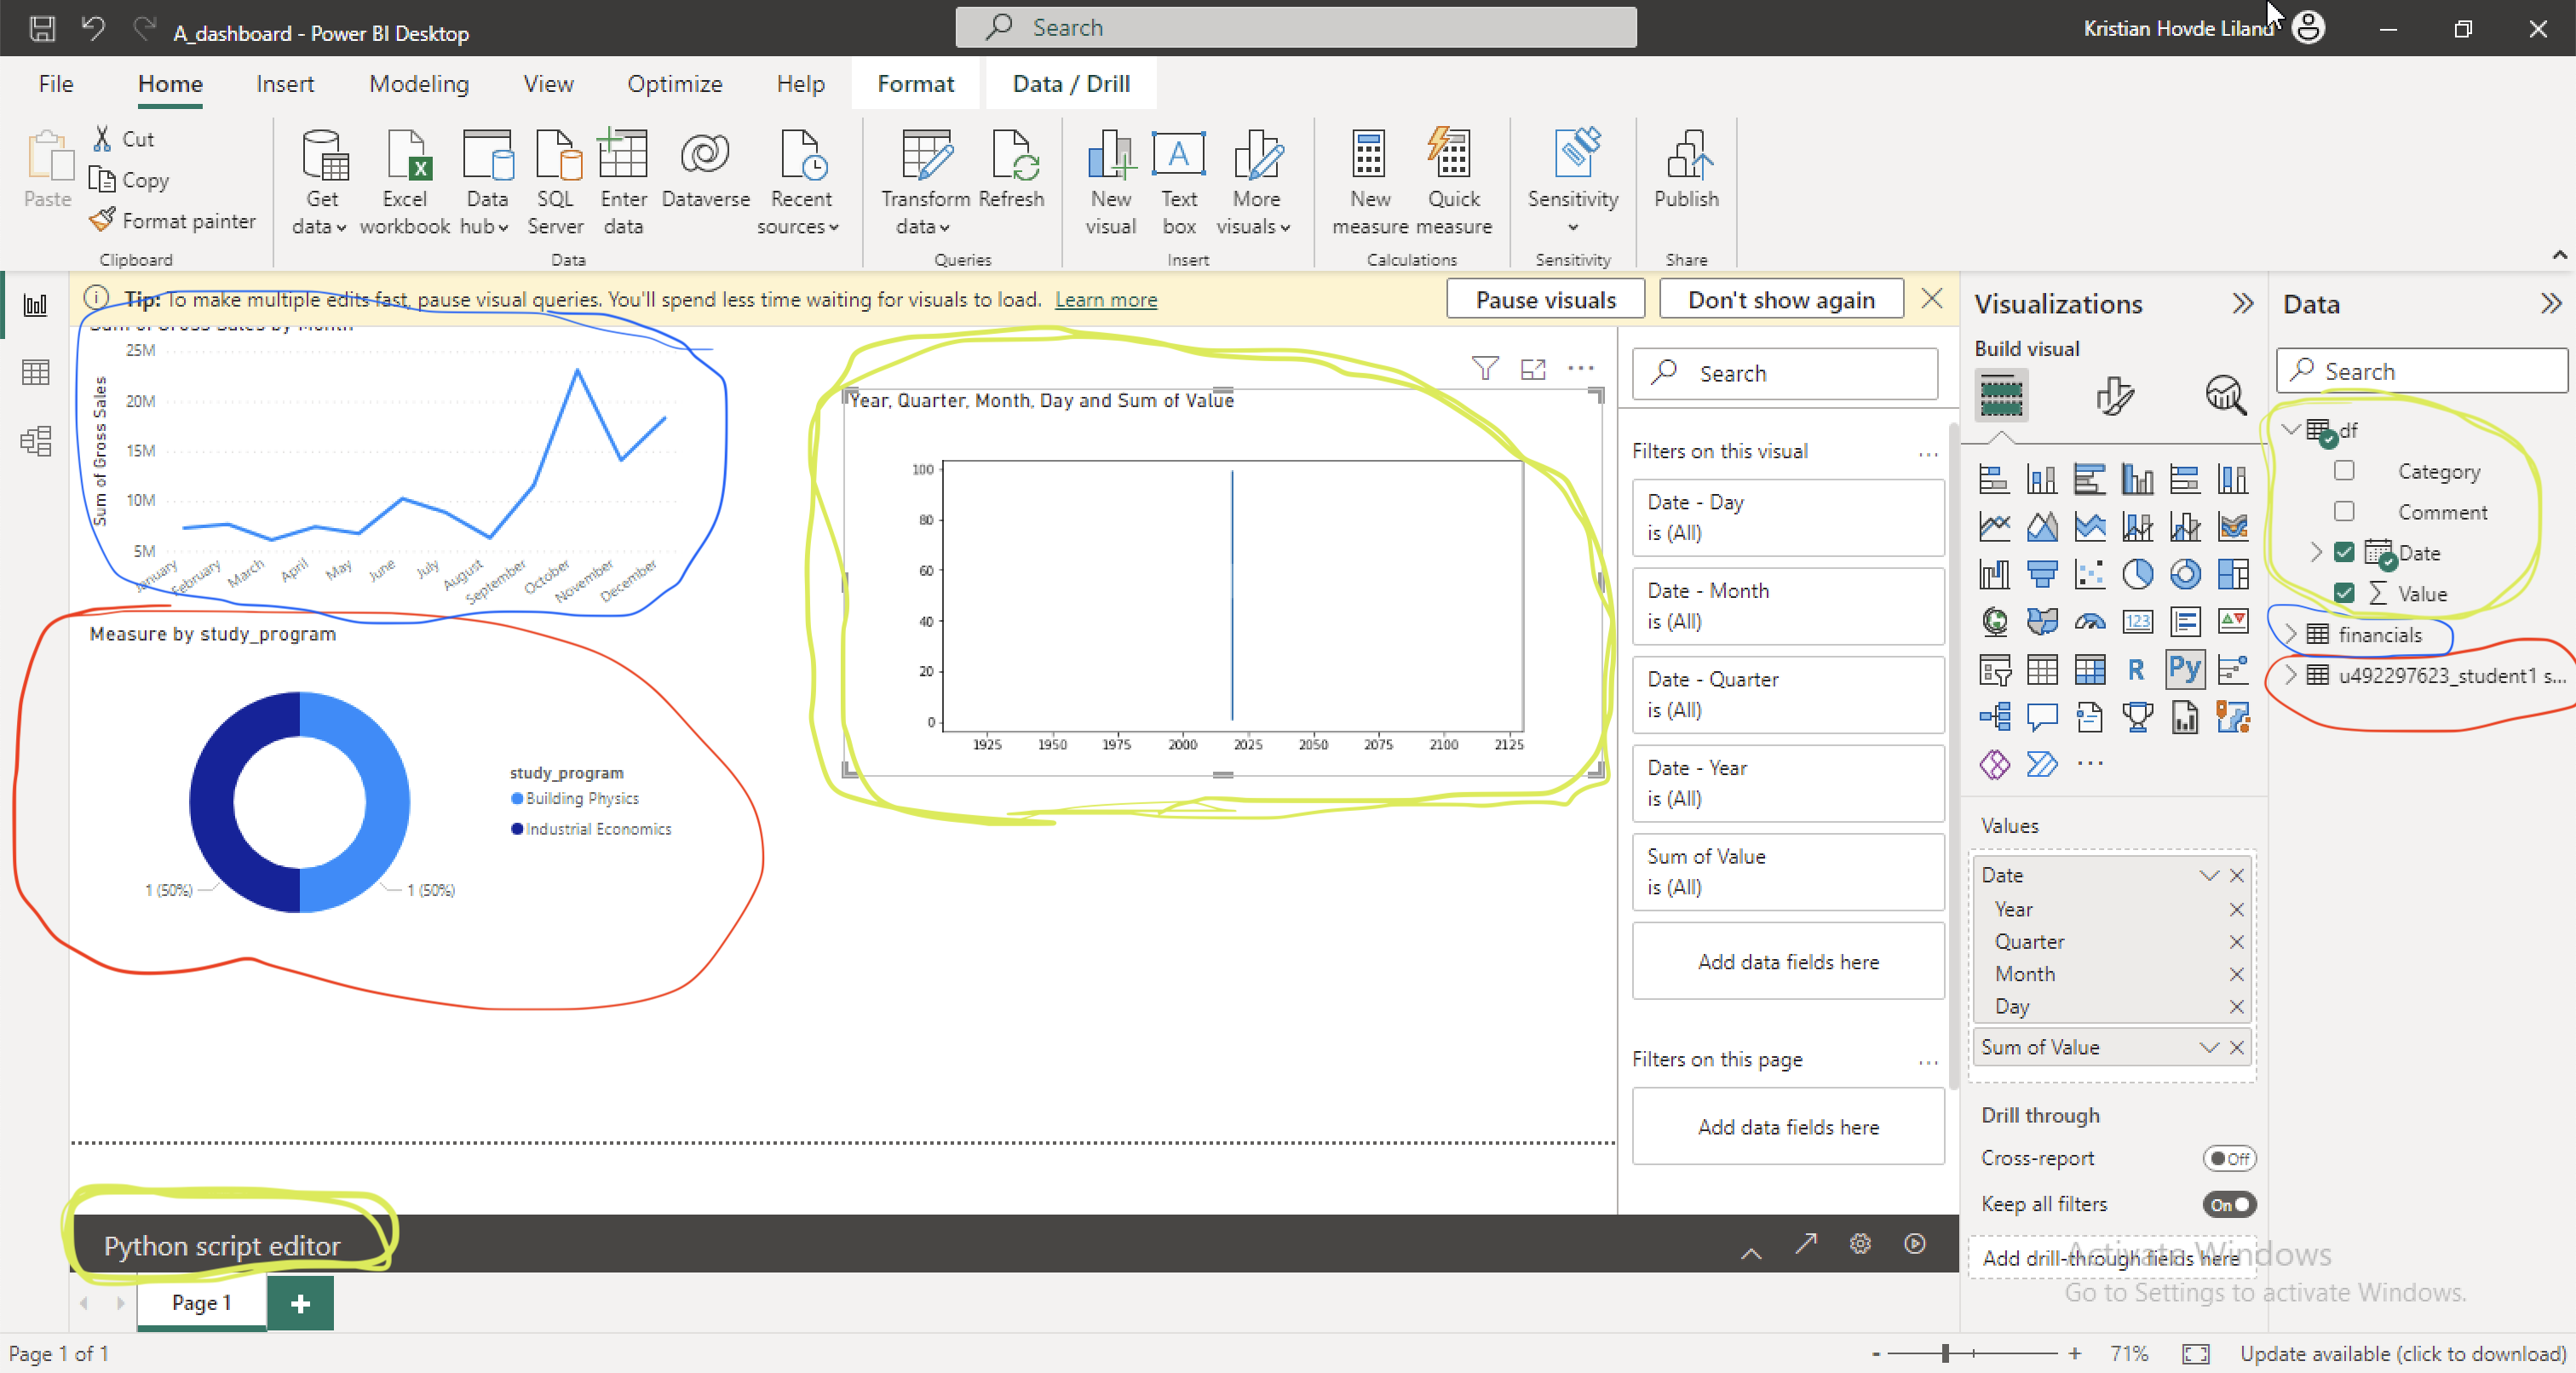
View from Power BI with three data sources and matching plots.
Excel file - blue rings
MySQL data - red rings
Python generated data - yellow/green rings
# Create random data for Power BI.
# Pandas DataFrame with four columns and 100 rows.
# Columns: Date, Category, Value, Comment
# Date: 2019-01-01 to 2019-12-31
# Category: A, B, C, D
# Value: Random integer between 1 and 100
# Comment: Random string of 10 characters
import pandas as pd
import numpy as np
import random
import string
import datetime
# Create a list of dates
start_date = datetime.date(2019, 1, 1)
end_date = datetime.date(2019, 12, 31)
dates = pd.date_range(start_date, end_date)
# Create a list of categories
categories = ['A', 'B', 'C', 'D']
# Draw 100 random categories
categories = np.random.choice(categories, len(dates))
# Create a list of random integers
values = np.random.randint(1, 100, len(dates))
# Create a list of random strings
comments = [''.join(random.choices(string.ascii_uppercase + string.digits, k=10)) for i in range(len(dates))]
# Create a DataFrame
df = pd.DataFrame({'Date': dates, 'Category': categories, 'Value': values, 'Comment': comments})
dfPower BI apps publishing
After publishing an app, it can be viewed online, in Teams or in other channels connected to the Power BI account.