Timeplot for Combined Effects
Usage
timeplot(
  object,
  factor,
  time,
  comb,
  comp = 1,
  ylim,
  x_time = FALSE,
  xlab = time,
  ylab = paste0("Score ", comp),
  lwd = 2,
  ...
)
Arguments
- object
ascaobject.- factor
integer/charactermain factor.- time
integer/charactertime factor.- comb
integer/charactercombined effect factor.- comp
integercomponent number.- ylim
numericy limits.- x_time
logicaluse time levels as non-equispaced x axis (default = FALSE).- xlab
characterx label.- ylab
charactery label.- lwd
numericline width.- ...
additional arguments to
plot.
Examples
data("caldana")
mod.comb <- asca(compounds ~ time + comb(light + time:light), data=caldana)

# Default time axis
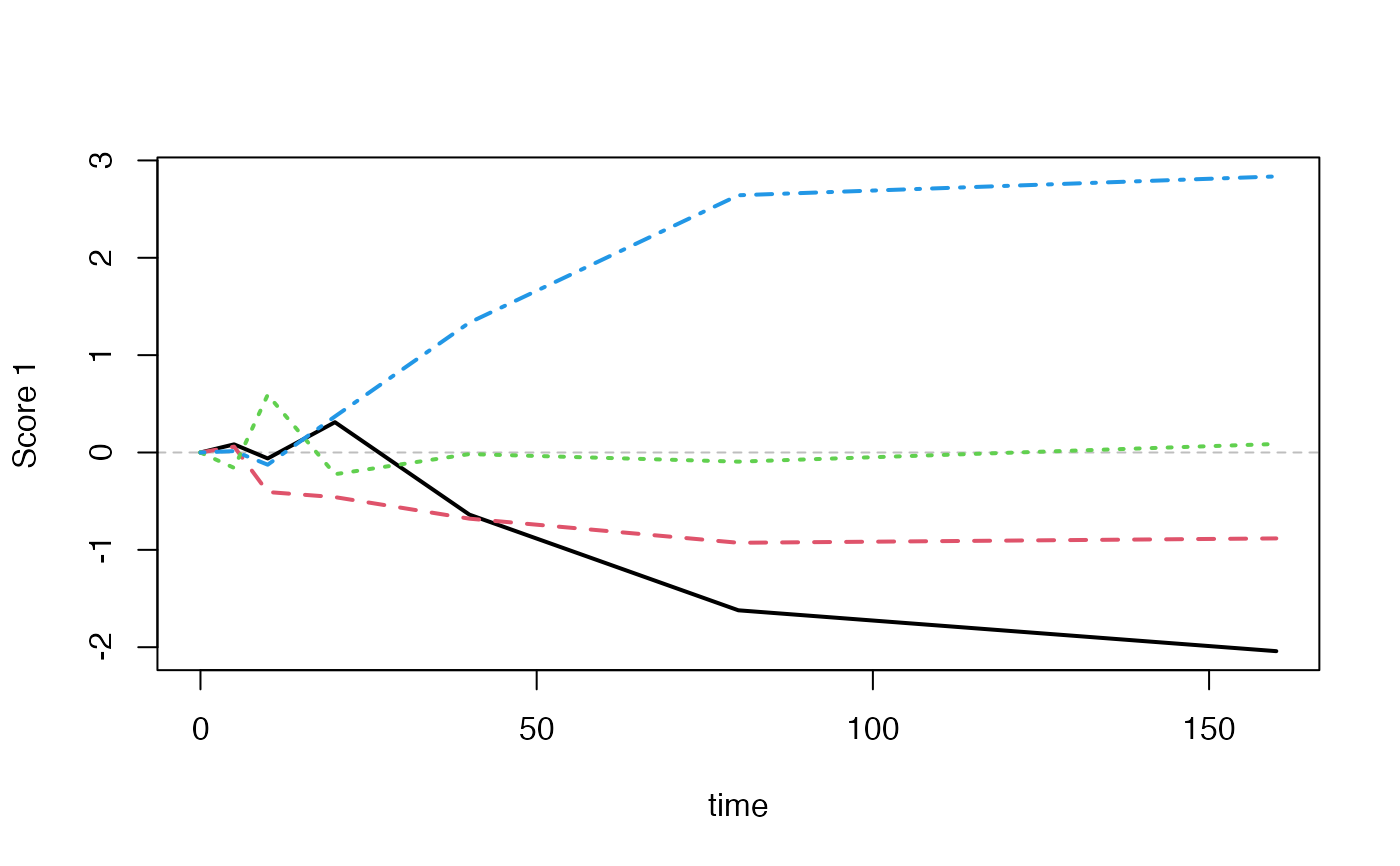
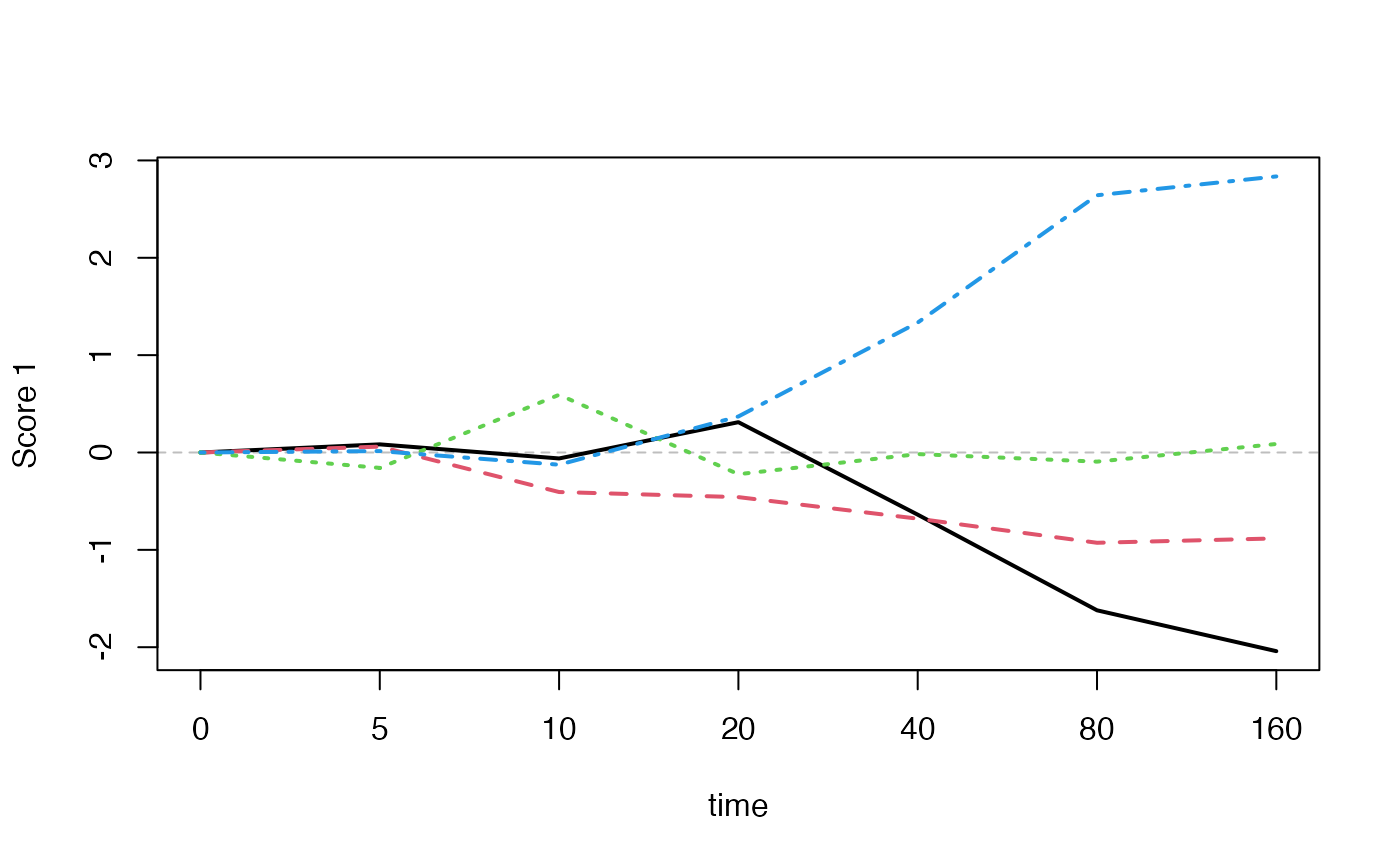
timeplot(mod.comb, factor="light", time="time", comb=2)


# Non-equispaced time axis (using time levels)
timeplot(mod.comb, factor="light", time="time", comb=2, x_time=TRUE)


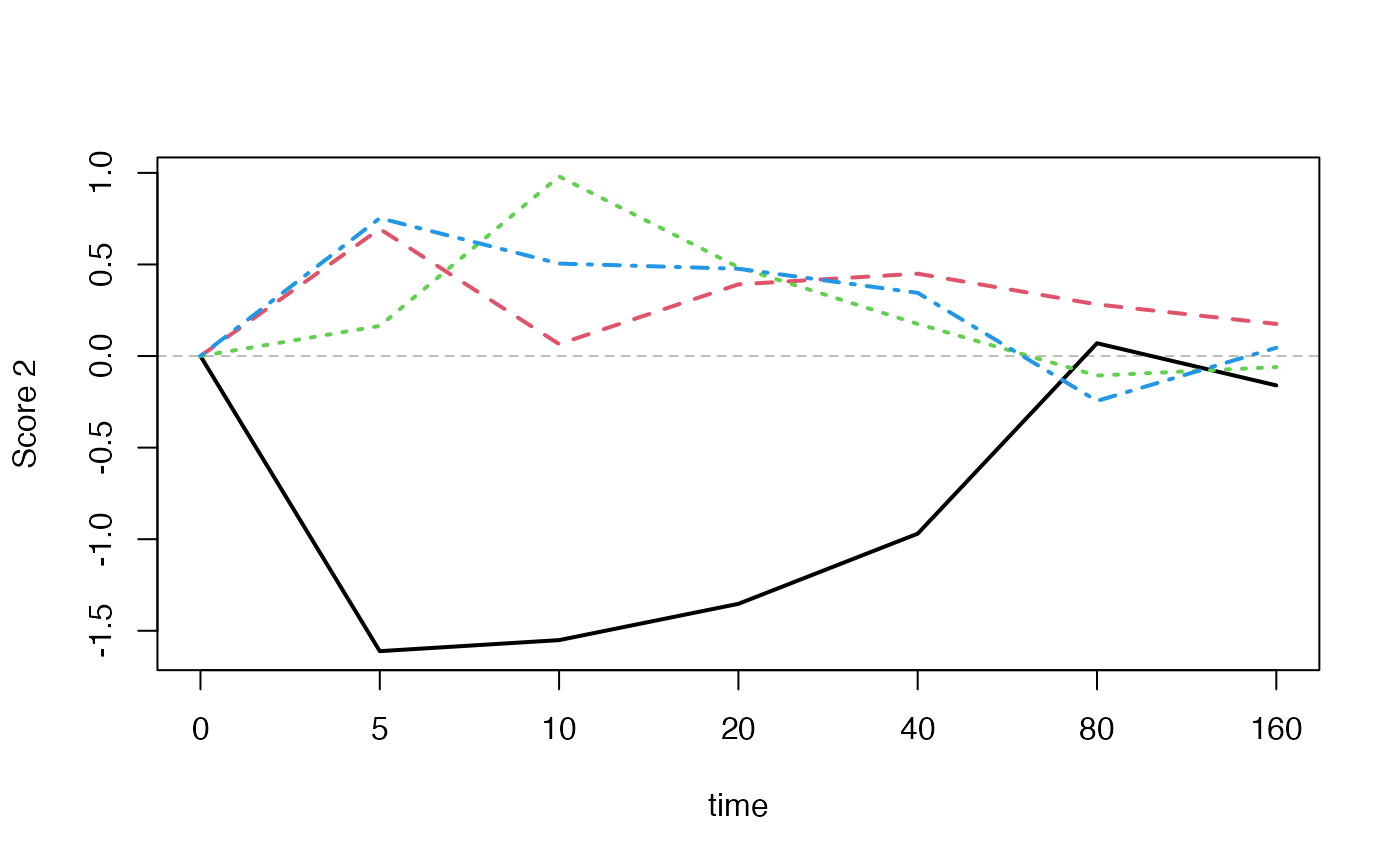
# Second component
timeplot(mod.comb, factor="light", time="time", comb=2, comp=2, x_time=TRUE)
