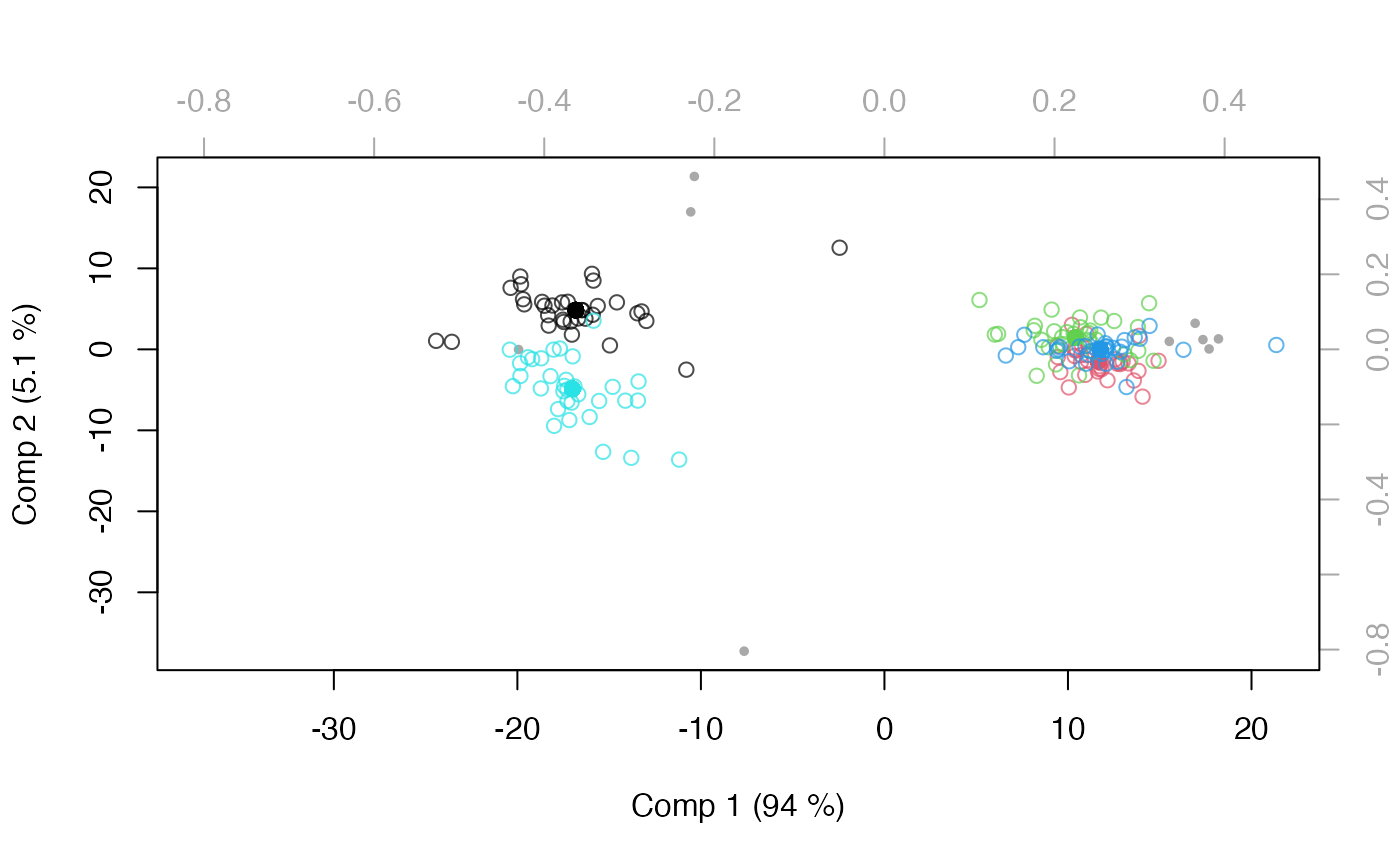
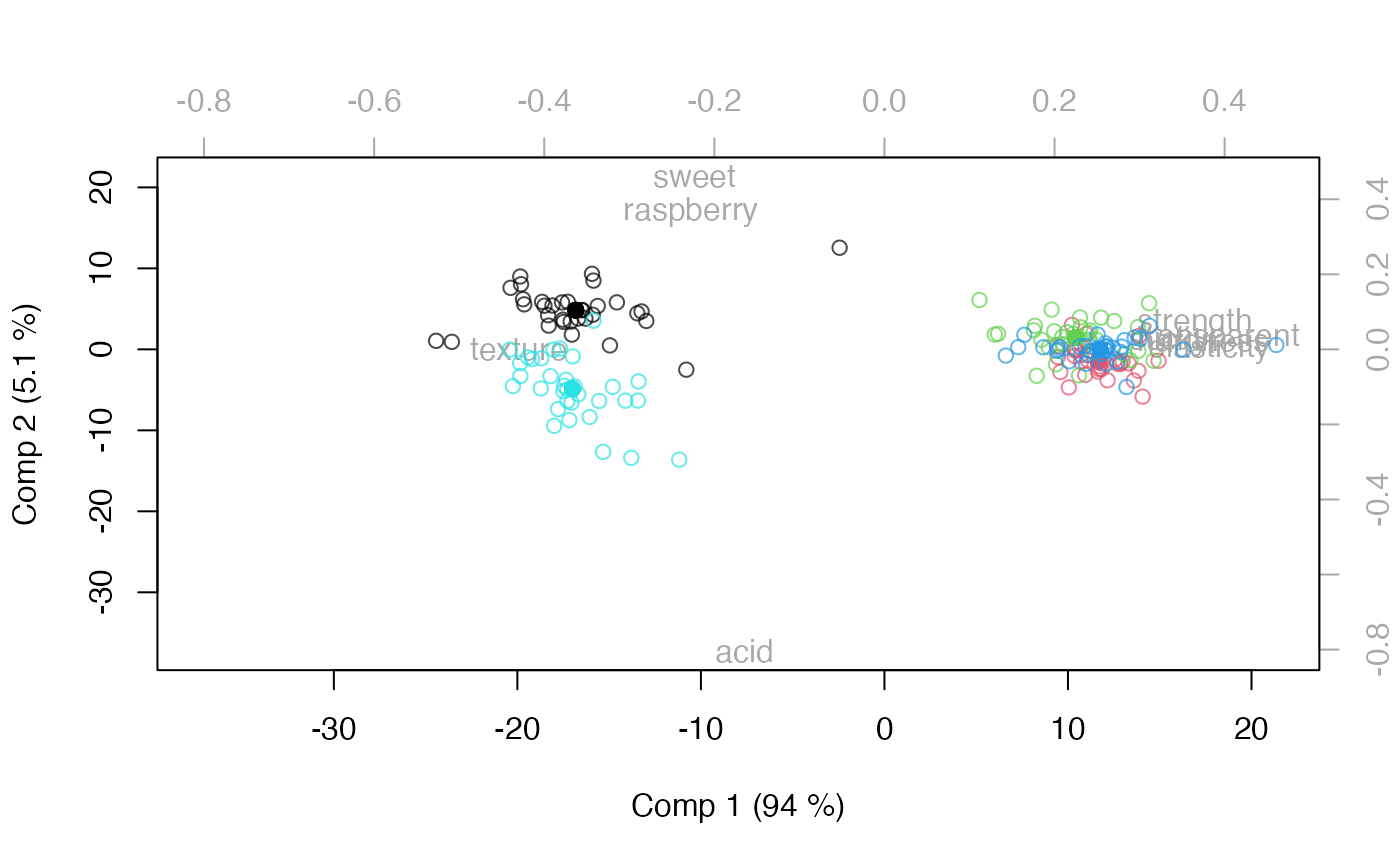
Biplot for ASCA models
Usage
# S3 method for class 'asca'
biplot(
  x,
  factor = 1,
  comps = 1:2,
  xlim = NULL,
  ylim = NULL,
  col = "darkgray",
  expand = 1,
  labels,
  legendpos,
  ...
)
Arguments
- x
ascaobject.- factor
Factor number or name.
- comps
integervector of selected components.- xlim
numericvector of length 2 for x-axis limits of the loadings.- ylim
numericvector of length 2 for y-axis limits of the loadings.- col
vectorof colours for score axes and loading axes and points/texts.- expand
numericexpansion for the scores, defaulting to 1.- labels
optional. If
"names", row names are used as labels. If"numbers", row numbers are used as labels. (Can also be a vector of labels.)- legendpos
characterposition of legend.- ...
Additional arguments to
plotandscoreplot.